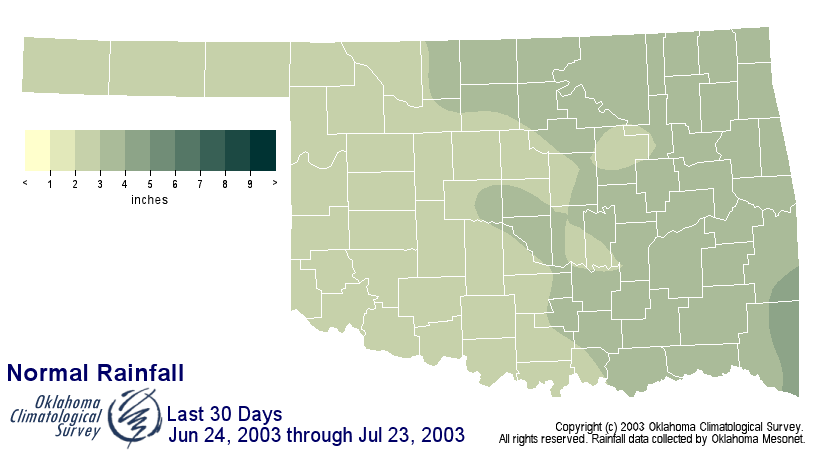
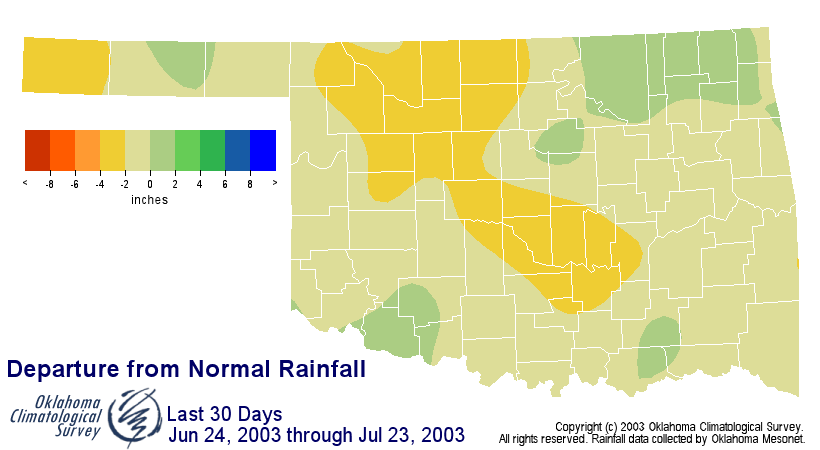
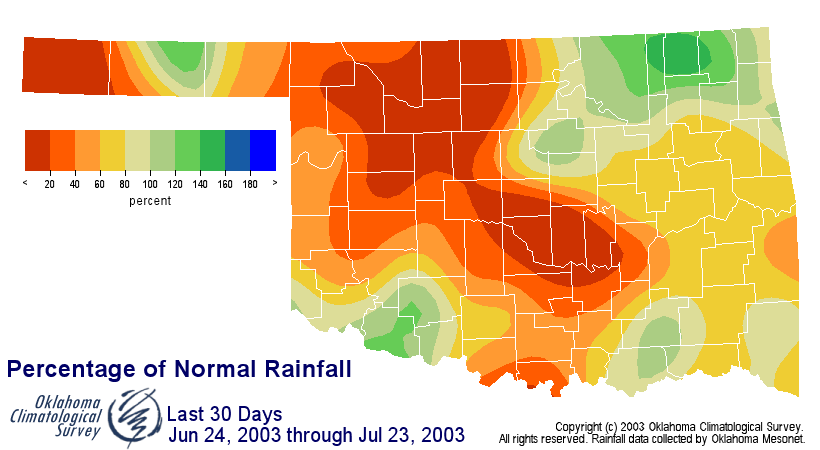
Last 30 Days
Jun 24, 2003 through Jul 23, 2003 |
Climate
Division |
Total
Rainfall |
Departure
from Normal |
Pct of
Normal |
Driest
since |
Wettest
since |
Rank since 1921
(83 periods) |
Percentile
Ranking |
Driest
on Record |
Wettest
on Record |
| Panhandle |
1.20" |
-1.35" |
47 % |
2001 (1.11") |
2002 (2.21") |
11th driest |
13th |
0.27" (1934) |
6.88" (1950) |
| North Central |
0.82" |
-2.31" |
26 % |
2001 (0.62") |
2002 (2.66") |
9th driest |
11th |
0.20" (1974) |
6.22" (1997) |
| Northeast |
3.75" |
+0.32" |
109 % |
2002 (1.90") |
2000 (5.23") |
34th wettest |
60th |
0.07" (1980) |
9.15" (1959) |
| West Central |
0.77" |
-1.72" |
31 % |
2001 (0.48") |
2002 (2.07") |
11th driest |
13th |
0.06" (1980) |
6.94" (1950) |
| Central |
1.43" |
-1.55" |
48 % |
1998 (0.77") |
2002 (2.19") |
16th driest |
19th |
0.11" (1980) |
8.55" (1950) |
| East Central |
2.08" |
-1.27" |
62 % |
1998 (1.97") |
2002 (2.83") |
25th driest |
30th |
0.14" (1978) |
8.76" (1961) |
| Southwest |
1.93" |
-0.65" |
75 % |
2001 (0.23") |
2002 (2.93") |
37th driest |
45th |
0.01" (1980) |
5.88" (1950) |
| South Central |
1.43" |
-1.54" |
48 % |
1998 (0.10") |
2002 (2.88") |
23rd driest |
28th |
0.06" (1934) |
7.78" (1948) |
| Southeast |
2.89" |
-0.86" |
77 % |
2001 (2.58") |
2002 (3.14") |
38th driest |
46th |
0.33" (1980) |
9.15" (1953) |
| Statewide |
1.81" |
-1.22" |
60 % |
2001 (1.41") |
2002 (2.51") |
20th driest |
24th |
0.18" (1980) |
7.23" (1950) |
Graphics
(click to enlarge) |
Total Precip
 |
Normal Precip
 |
Departure
 |
Pct Normal
 |


